Reason For Update:
We are delighted and excited to announce a major overhaul of our MI & Reporting area in BP. As you know we are continuously trying to develop and improve the system but we can not work on all areas at once. Over the last couple of years we have enhanced literally hundreds of features within the system and added the potential to capture more and more data. Now we have worked to bring the visual reporting of this data up to the same level!
The MI (Management Information) area of the CRM allows you to track, monitor and report the most significant data of the business. This is displayed in a dashboard format with tables and graphs to give you a visual display of your performance at a glance. As part of this update we have redesigned and restructured the MI section to provide a cleaner and more concise display of the most important figures in your business. For those who have used our original MI section you will see we have removed the Overall Direction Data and Visuals and brought in more defined Sales, People & Sales Areas, Leads & Products, Status, Ops and added new, specific Marketing Dashboard.
Please note: The MI dashboards can only be seen with a Super Admin role. It does not appear in the options for a standard full license. If you would like access to these reports or believe they are valuable to your company please speak to relevant user in your business.
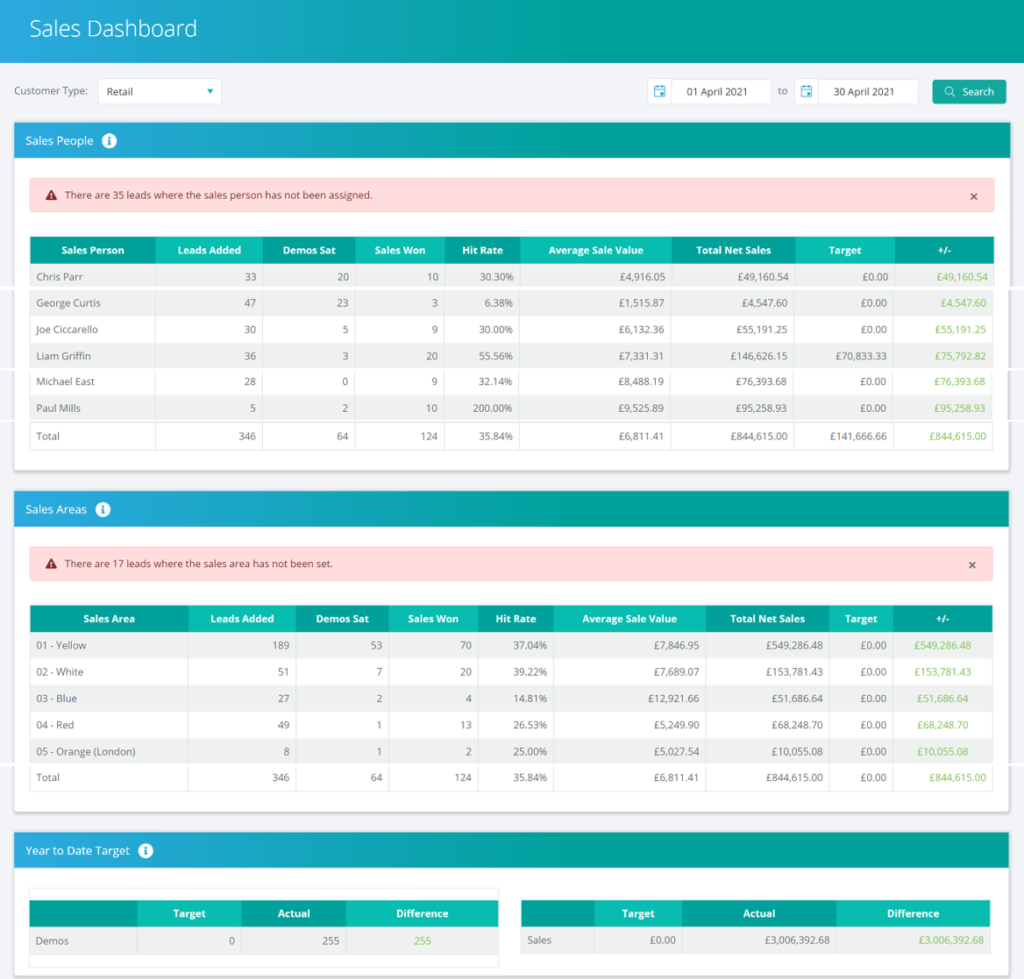
Sales Dashboard:
Our Sales Dashboard now focuses purely on Sales performance information by individuals and areas. The Sales Report includes the Sales People you have active within the Report Date specified, the amount of new Leads added, the Demo’s booked in that timeframe and the Sales Won. These are no longer tied to each other, it is a total report from the selected period so you have a total overview of leads allocated and sales made rather than relating to one another.
The total now aligns with the Sales Report as the Sale Value comes from the Contract Value not the Lead Value, meaning VOC’s and adjustments are also factored in for complete accuracy.
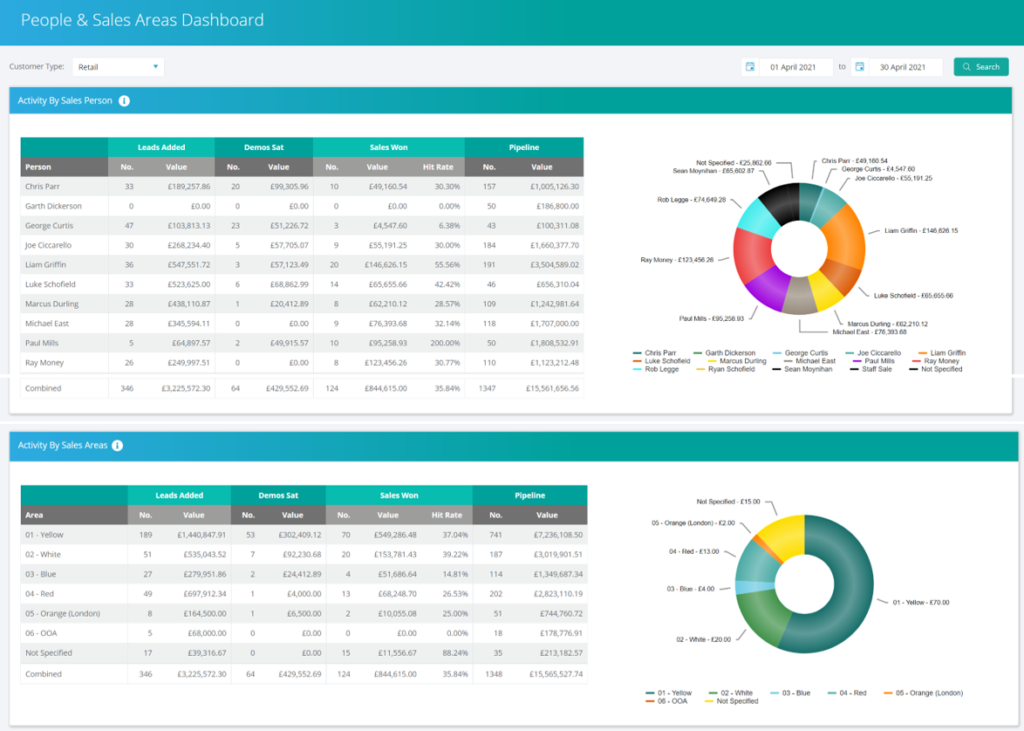
People & Sales Areas Dashboard
This MI Dashboard focuses purely on the activity of the Team, or Sales Person, and Sales Areas which includes a similar breakdown than the Sales Report.
Data is based on the number of Leads added during a specific period regardless of their current status. This gives an indication as to the performance of the Sales Person in converting Leads to Sales as a whole. The value of Leads is based on the Lead value, and the value of Sales is based on the Contract value.
The dashboard also shows you the value of the Live Pipeline at the date of the report as well!
With interactive and smart pie charts you can change which Sales Persons or Sales Areas to include by selecting the headings beneath. This report defaults to Retail, however, you can now select Trade, or All next to the report date selection on the top, right-hand side of the screen if required.
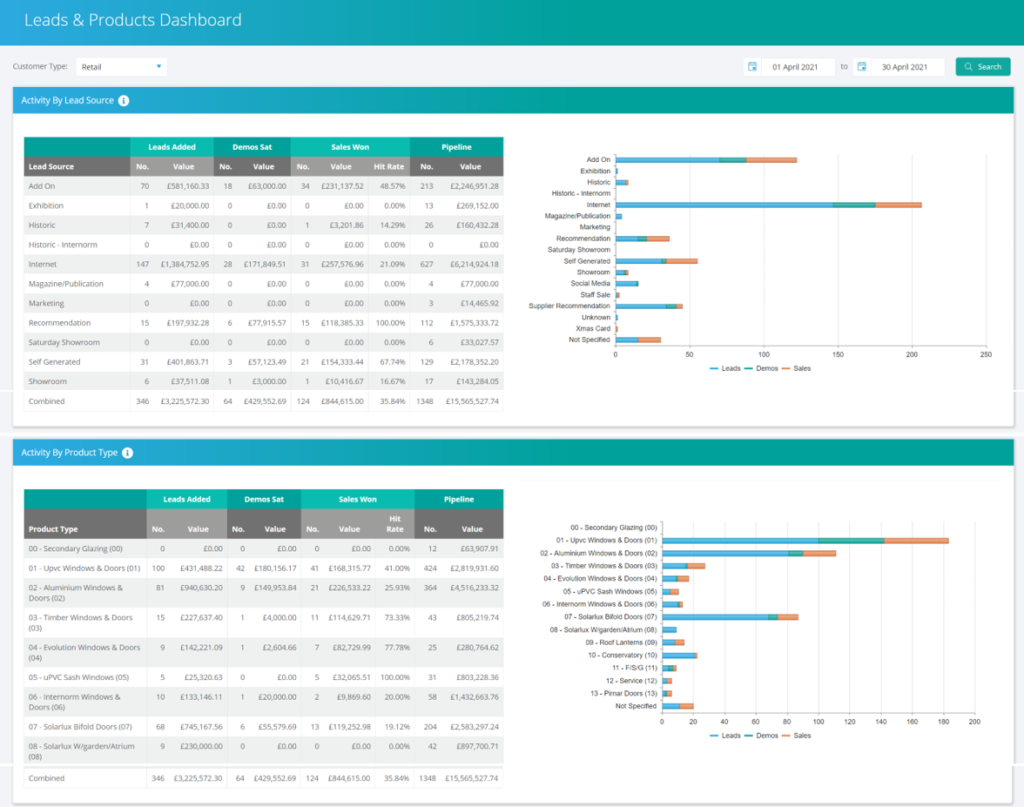
Leads & Products Dashboard
This report attributes the lead, demo, sale and pipeline information to the Lead Sources rather than the Sales Representatives. Activity is also displayed by the Primary Product Type (Product Type 1) and Product Interest so you can see exactly what products are in high demand or what product areas your upcoming sales are likely to come from.
The main visual change is the bar charts, previously line graphs, which give you a better visual experience on what’s happening. Again, by clicking on the headings below the bar graph you can filter these down as required.
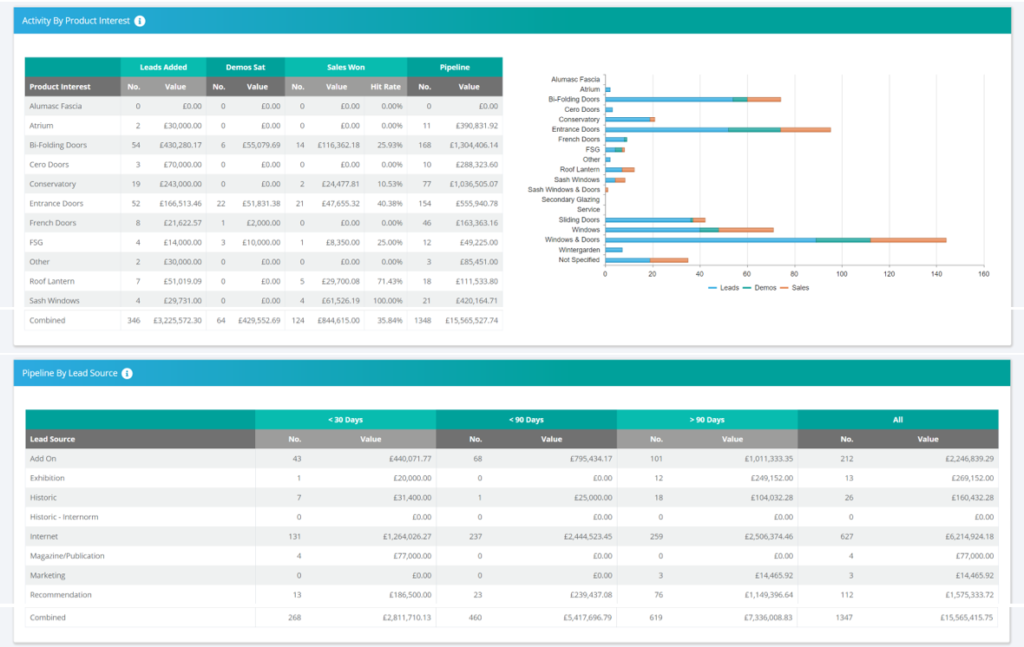
The pipeline by Lead Source, towards the bottom of the report, shows a breakdown of the Live Pipeline for the period report date. This breaks down the number of Leads by the time they have been live, <30 days, <90 days, >90 days.
Status Dashboard
The Status Dashboard gives a visual display to your pre-built Status Pipelines, broken down in to Lead & Contract. Essentially this is a visual display of the Status Summaries but with coloured pie chart displays you can see exactly how many of your leads/orders are at any status at any time! You can also filter these charts by the number (volume) or by the overall value!
This Dashboard is set to filter to Live Statuses but you can include Sold, Lost or Completed Leads & Contracts by selecting the headings.
You can also filter the displays by Sales Person or Contract Owner to see exactly who is managing what in your business at any time!

Ops Dashboard
Arguably our most powerful development yet! If you find yourself asking ‘What is my business doing at this time?’ then find out here! You can now see snapshots of the most substantial and frequently used reports we hold in Business Pilot with a link to such reports beneath.
The Sales (total sold), Banked (total banked), Balances Outstanding (what’s owed), Orders on Hand (value to be invoiced), Invoiced (Sales Invoices), Fitted Value (value of the schedule), Costs and Gross Profits (from the Completed Contracts Report). Visually see exactly where you are at any given time!!

Marketing Dashboard
Last but not least, we have created a new Marketing Dashboard. Data is based on the number of Leads and Demos that came in or occurred in the report date period selected.
CRM and marketing go hand in hand. CRM data can help your marketing team identify, capture, nurture and convert leads; track customer-salesperson interactions; monitor drip campaigns within the sales cycle, and more. All of this can create a smoother and more consistent customer experience. Here you will be able to find out which Lead Sources are performing the best against the targets and budgets. Seeing the breakdown between Cost of Leads, Demos and Sales in Lead Sources, Product Interests and product types will allow you to track your marketing closely.
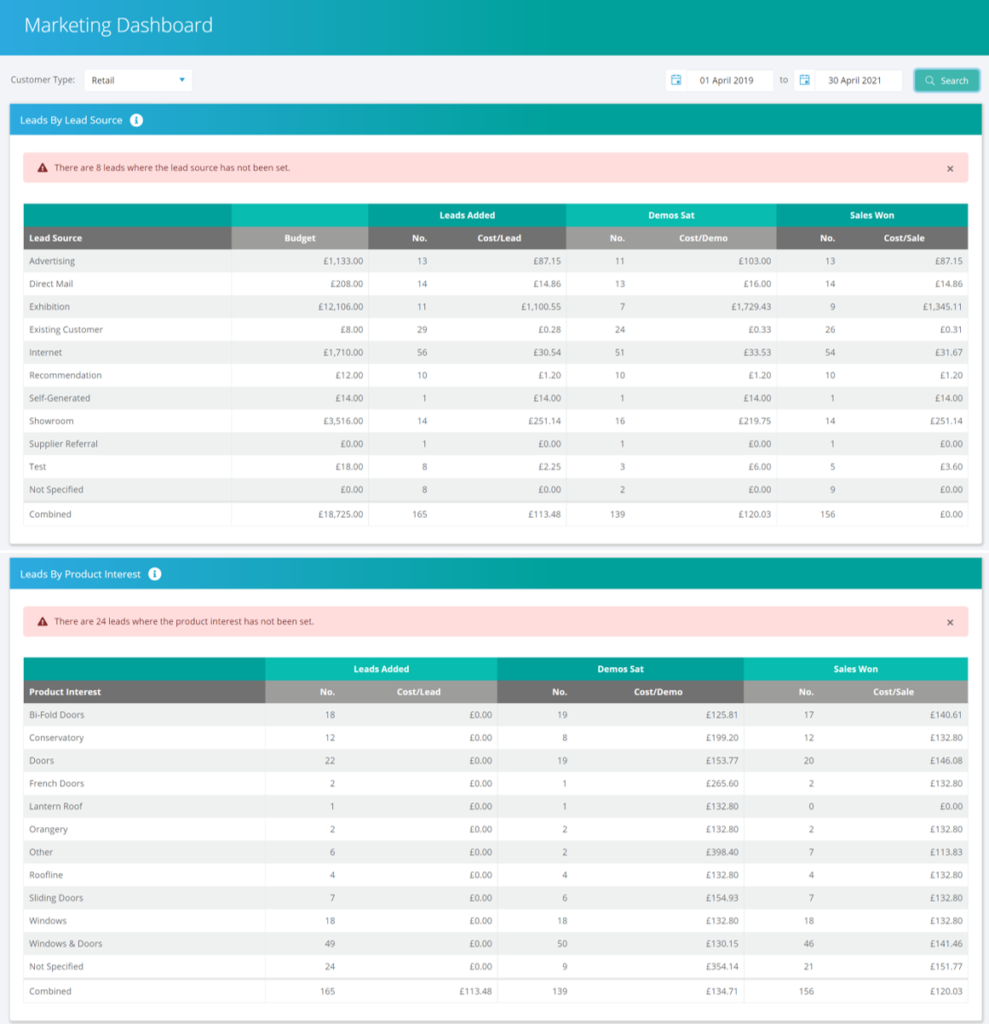
If you have not already set up Targets within Admin > Manage Targets, there will not be any information relating to such targets in the following reports.
Business Pilot has a continual development cycle and all new features are included within your subscription. In fact, as a user, we encourage you to ask for more! That way, we all benefit from a continually improved system.